μMon: Stupid simple monitoring
Let me introduce you to μMon, my personal, minimalist, opinionated take on host monitoring based on RRDtool, SNMP, some lightweight shell scripting, and a small FastCGI server written using a modest subset of modern C++.
Migrating my monitoring setup to μMon also serves as a case study in complexity reduction, which is the broader theme of this post.
Here is an example of how μMon might look like:
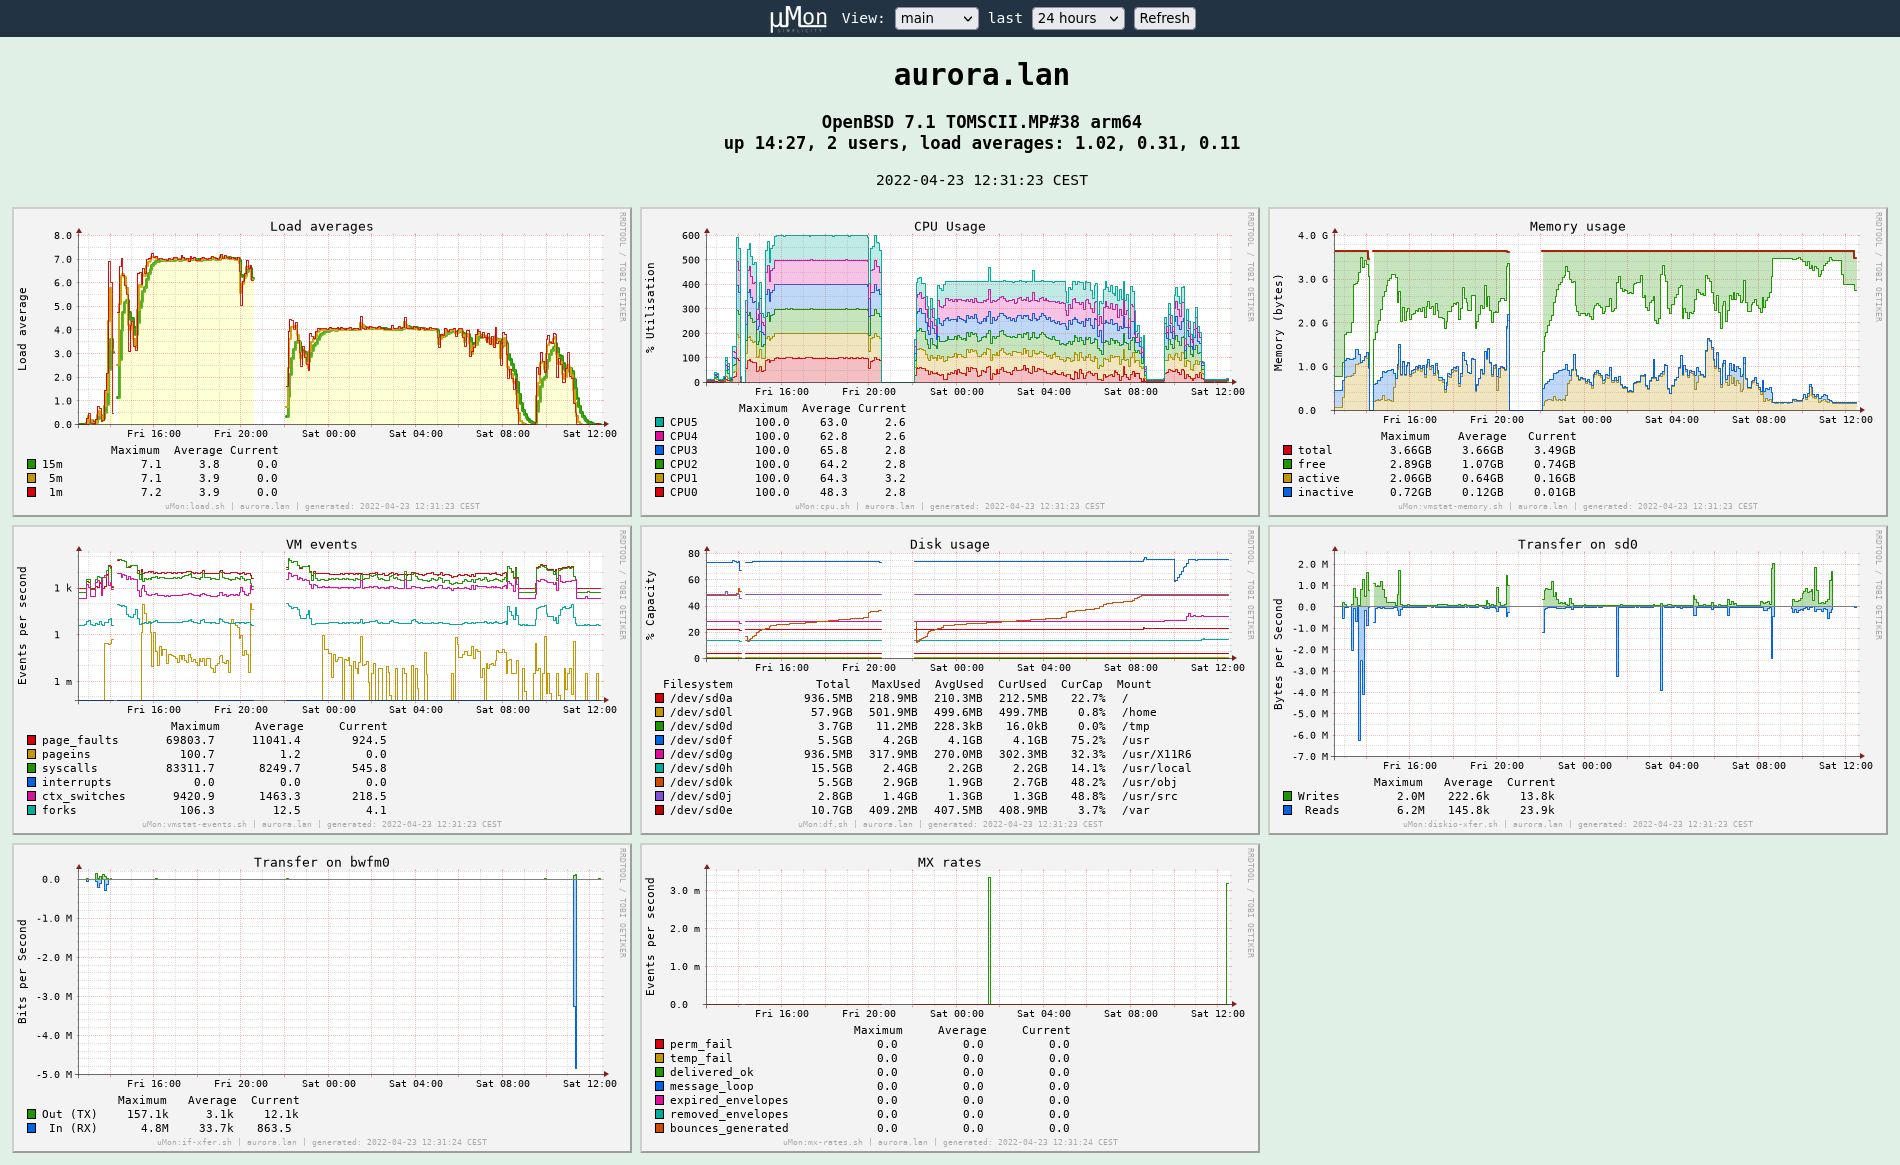
Main view of my Pinebook Pro (click to enlarge)
The above view covers the better part of my Pinebook Pro upgrading itself to OpenBSD 7.1, compiling the whole system from source. The vertical gaps are due to the machine being off.1
Here is a second example with a different view on another host:
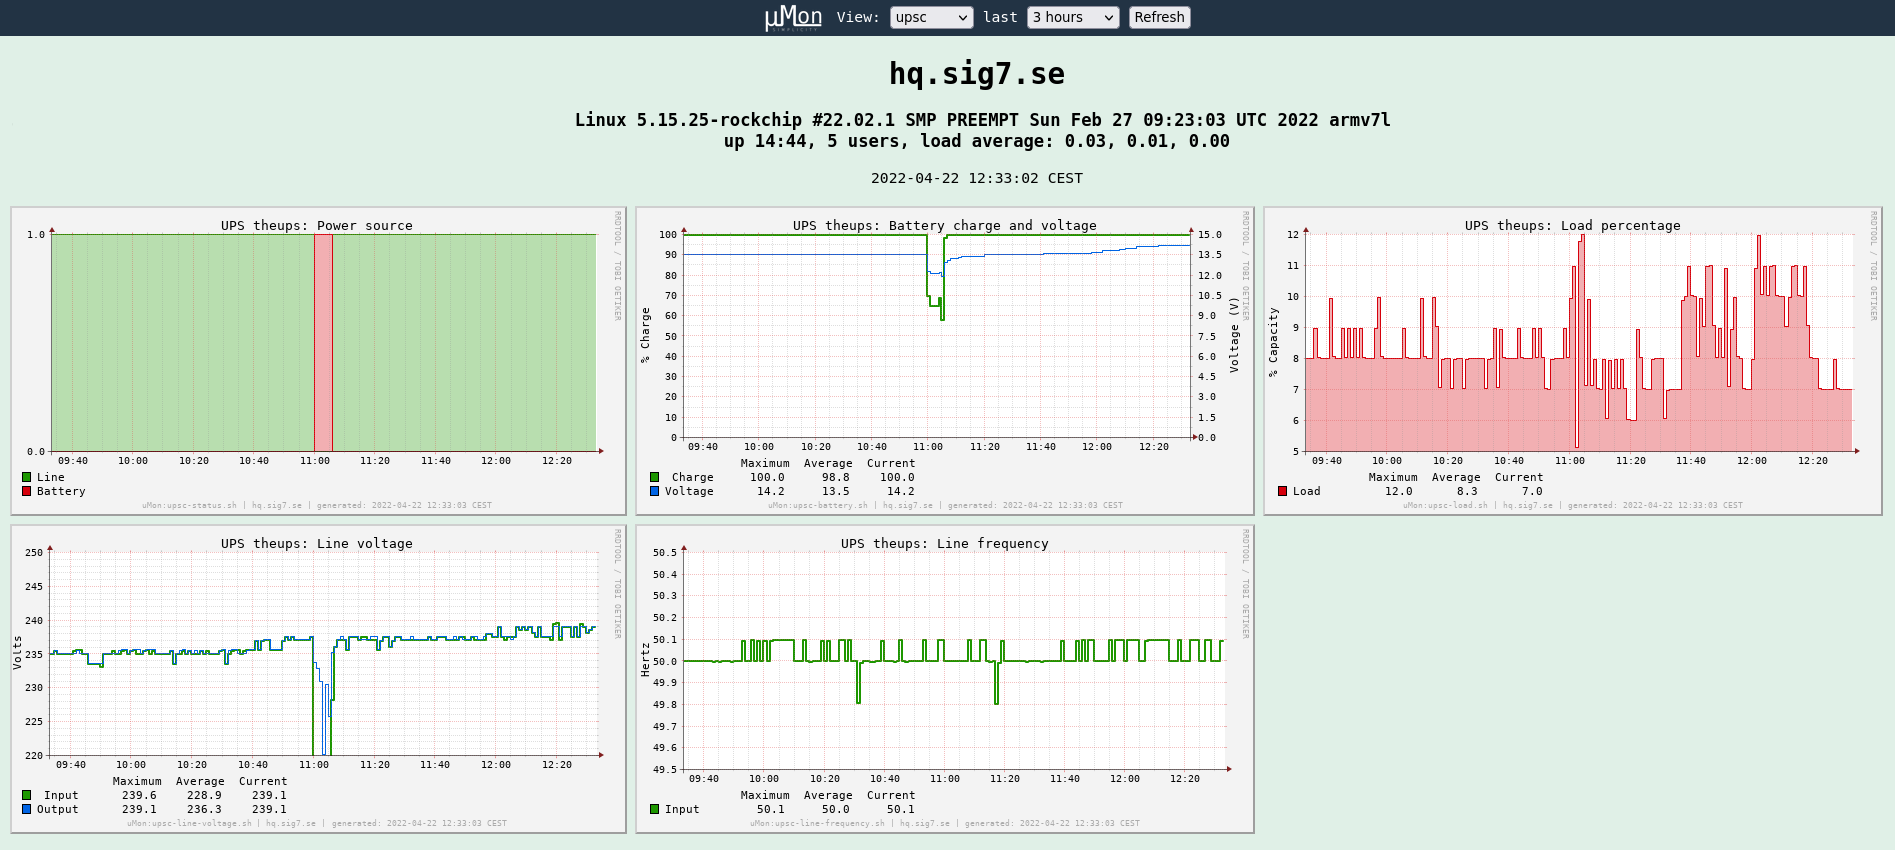
Upsc view of the server that brought you this webpage (click to enlarge)
This view captures a short planned test of my UPS (visible in the
middle). Data is sourced directly from the output of the upsc
command, as opposed to
SNMP.
(Yeah, I know. Time for a new UPS battery.)
Why μMon?
I created μMon due to my love of minimalism and how short existing solutions fall from that ideal. Specifically, I migrated my stack of Prometheus + Grafana that I have been running at home for the last couple years to μMon. By doing so, I managed to finally get rid of:
-
A full-blown time-series database (with gigabytes of rolling on-disk data).
-
Several Go binaries dozens of megabytes each, also consuming runtime resources. (One of them got habitually stuck in an endless loop, so I put in a crontab entry to restart it daily. I do not appreciate black boxes like that.)
-
Lengthy configuration files and lengthy argument lists to said binaries.
-
Systems continuously talking to each other over the network (even when nobody is looking at any dashboard), periodically pulling metrics from nodes into Prometheus, which in turn runs all sorts of consolidation routines on that data. A constant source of noise in otherwise idling systems.
-
A mind-boggingly complex web front-end (Grafana) with its own database, tons of JavaScript running in my browser, and role-based access control over multiple users.
-
A bespoke query language to pull metrics into dashboards, and lots of specialized knowledge in how to build useful dashboards. It is all meant to be intuitive, but man, is it complicated! (People write whole books on how to operate and use this!)
-
Tons of eye candy I did not really mind, but did not really appreciate either.
No doubt this complex (and to me, opaque) stack would inevitably get obsolete, necessitating migrations prone to failure, or demand my attention in other, even less predictable ways. In short: keeping up with the state of the art requires an ongoing investment.
I have a general inclination towards minimalism, and a preference for long-term durable solutions that do not need continuous attention and care. Having spent many years as a student of complexity (commonly referred to as a career in IT), I have come to hate the kind of surprises that complex (clever, if you will) systems are so prone to. Nowadays, when I provision something, I ask: would this run for 10 years if I forgot about it? How long before it would break, or need to be redeployed with a new (incompatible) major version? Or, if nothing else, go hopelessly out of fashion (hello docker!)?
So I substituted all the above with an extremely lightweight stack based on very well understood, several decades old concepts and programs. I now have a system that is comprehensible in its scope and size, and trivially understandable in its simplicity. I did this in the hope that it will serve me for decades to come, without any undue need of caring for it. In fact, my ambition was to solve the problem of server monitoring once and for all, at least for all systems in my care. This fits neatly into my overall strategy of establishing fully autonomous, sustainable personal computing. Less bells and whistles, less overhead and less churn equals less to worry about, while keeping all the features actually needed.
By the way, I am not meaning to pick on Prometheus and Grafana in
particular. If you have used Cacti, Collectd, Graphite, InfluxDB,
Nagios, OpenNMS, Zabbix, or anything similar, then you will probably
agree that setting up and using any of these tools is anything but
simple. In fact, any monitoring stack will be similar to what I
described above in terms of its complexity.2
Granted, if you get paid as a sysadmin DevOps Site
Reliability Engineer, you probably need to master some locally
useful combination of these comprehensive tools. If that is not your
job, and you want something simple and
stupid, you might find
μMon interesting.
Keeping it simple and stupid is such a priority that as an all-time reminder, I decided to include the word simplicity right in the μMon logo I “designed”:
![]()
In total, I estimate that I spent the equivalent of at most one week of full-time engineering work (scattered over about a month of evenings and weekends) on creating μMon. Including the logo!
Granted, μMon does not cater to every need, only my very own — and those are definitely modest. I do not run anything that could be considered modern or fashionable; I only run a bunch of Unix boxes (a mixture of Linux and BSD). No Docker (or podman), no ProxMox, no Kubernetes. Anywhere I get to decide, I use stable, proven, old technology. In addition, my monitoring needs are fairly modest: I only want basic metrics. Most importantly, I do not use any fancy alerting functionality.3 That could be added on top of what exists in μMon, but it stands for a sizable chunk of complexity in the “real” monitoring systems mentioned above; getting it right is very non-trivial, and not just from a technical perspective.4 Since the small-scale servers I run work pretty much unattended year in and year out, this is fine — I only want to be able to look at metrics to spot trends and interesting times to investigate by looking at event logs, etc.
That said, μMon gives me everything I have ever gotten from my
old setup (mostly the “interesting subset” of the output of
node_exporter, plus the metrics of a custom upsc feeder I hacked
together). And there are distinct advantages to μMon:
-
A well understood, constant-space storage model thanks to RRDtool. I know exactly how much disk space the aggregated data takes, and more importantly, I know it will never grow beyond that extent.
-
A well understood model of data consolidation and retention, built on RRDtool’s consolidation functions. I can look back at anywhere between the last one hour and the last two years, with the right temporal resolution.
-
Independent nodes. Each host runs μMon on its own, both to collect metrics and to serve the webpage. There is no single point of collection, storage, or access to the system, nor a single point of failure. (Arguably, this can be a disadvantage depending on your perspective, but it matches my preference.)
-
Very lightweight data collection. Each host collects its own metrics in locally stored round-robin archives; data collection does not incur any network activity. Configuration of metrics collection equals listing the probes you want (but you can use all the power of shell scripting, if you wish).
-
Very simple server setup. I use
(x)inetdto serve the FastCGI of μMon via a TCP socket to whatever web server I have on the host (or a different host). The μMon collector script is run by cron. Everything that belongs to μMon resides and runs under an unprivileged user. -
Extremely minimal dependencies. To install μMon, all I need is a Unix system with a POSIX shell (
/bin/sh), a modern C++ compiler, and the ability to installrrdtool. No PHP (or other web toolkit), no Python, no NodeJs. No database (time-series or relational). A local webserver (with FastCGI support) is optional; a remote webserver can act as the proxy as well. -
Graphs (plots of certain groups of metrics) and views (collections of graphs) can be created or modified any time, by editing simple, small shell scripts. They can even be edited in place for immediate effect (nothing to restart). Of course, knowledge of RRDtool and the POSIX shell is mandatory, but then again, μMon is for hardcore Unix sysadmins with modest needs. Anything you need to know above what is already etched into your brain you will find in the
rrd*man pages. But you can get started without changing anything.
Not invented here?
You could argue that I am exhibiting NIH syndrome by inventing my own (inferior) solution to a problem space well understood and explored by many, many others. You would perhaps not be very wrong.
To my defense, let me state that I am not forcing (not even encouraging) anyone to adopt and use μMon. Rather, I am showing it here as a case study in the noble pursuit of complexity reduction, something that I feel is getting more and more important. Especially when focusing on one’s own personal computing affairs.
Reduction in complexity
Here is a table to recap the transition from all-in to minimal complexity. Note that this is not a moral stance against higher complexity, which you might need for fully legitimate reasons (such as requiring complex alerting over metrics aggregated from different hosts) that μMon does not support.
| Aspect | Prometheus + Grafana | μMon |
|---|---|---|
| look and feel | shiny, modern | old-school |
| development | probably several man-decades | one man-week (tops) |
| system model | central servers, distributed feeders | one independent node per host |
| technologies | Go, HTTP, JavaScript, TSDB, … | /bin/sh, RRDtool, SNMP |
| daemons | collectors, prometheus, grafana | umon_fcgi invoked by (x)inetd |
| database | bespoke TSDB with WAL, etc. | RRDtool |
| db size | dynamic; gigabytes | constant; a couple megabytes |
| db activity | has its own inner life, runs GC, etc. | static (in-place RRA overwrites) |
| frontend | complete web stack | FastCGI server invoking hooks |
| configuration | point-and-click, stored in opaque db | small shell scripts |
| plugins | bespoke (large) binaries | SNMP and simple shell scripts |
| collection | over the network | local (works offline) via cron |
| alerting | complex conditions, several channels | no support at all |
| maintenance | ongoing upgrades & migrations | minimal, if any |
Conclusion
I am not saying that “big solutions” are necessarily bad or wrong. But I do want to argue that there is a place for small, perhaps even bespoke, site-only solutions that can serve the common 80% of needs just as well, at several orders of magnitude less complexity. All the while retaining nimbleness to be extended to cover the remaining 20%, when prompted by actual need. There is something to be said for a (figurative) napkin’s worth of code hacked together in a man-week that is capable of bringing the same ultimate value as a full-fledged stack that was no doubt developed in what is probably several man-decades (if not centuries) of engineering work. Sometimes a simple, dumb solution can be fairly robust and complete. I believe μMon is a good illustration of this general idea.
At the same time, I feel this is ultimately less of a surprise than it might first seem. Let us not forget that running Unix-descended or Unix-like systems means we are standing on the shoulders of giants: we have time-proven architectural tenets, open standards and systems programming APIs, plus free development tools at our disposal. On top of that, the venerable RRDtool embeds some pretty sophisticated, time-honed data sampling and graph rendering logic. Granted, it takes an educated sysadmin to make use of it all (being a competent systems programmer as well is a big plus), but that is pretty much the original intended audience of these operating systems.
μMon is released to the public under the BSD license (the same zero-clause flavour that OpenBSD uses). If you feel inclined to try it yourself, please recall that it is not my goal to supply you (or the world) with a toolkit that works out of the box and suits everyone. I am specifically not advocating μMon as a direct substitute to any of the well-known monitoring stacks.5 In the spirit of the BSD license, it is simply my gift to the world. What you do with it (whether or not you find it useful) is up to you. At any rate, you are expected to read your way through some simple shell scripts and adapt them to your needs. That said, if you have educated questions or constructive feedback (positive or negative) about it, feel free to contact me.
1 The machine froze Friday night, which I did not
notice for over an hour. Apparently building the OpenBSD base system
with -j 6 was too much to ask from the hardware, so I resumed with
my usual -j 4.
2 What looks like the closest existing solution to
μMon is a stack of programs called
symon, consisting of
(at least) symon, symux and syweb. This is also largely
RRDtool-based. But… the user needs to configure listeners with port
numbers just to get some data collection going; needs to install
RRDtool into a webserver chroot; needs a webserver with PHP enabled,
etc.
3 I do have my personal collection of cron-driven scripts that check essentials (such as expired SSL certificates) and email me if there is anything that needs my attention. I just prefer to keep these things separate from monitoring data rates and disk usage percentages.
4 I could rant about the incessant floods of useless email/pager alerts coming from everywhere, seemingly so inseparable from Big Tech Company Culture, complete with the inevitable result of people ignoring/filtering them out, for a net result of precisely zero business value achieved at a tremendous cost. But that is another post patiently waiting to be written.
5 Let’s be real: μMon absolutely does not support many of the important use cases of the more complicated stacks. Do I care about any of it? Absolutely not. The point of this exercise was not to create a rewrite of Prometheus + Grafana (they are fine as is), but rather create something that is at least three orders of magnitude smaller, while providing all the functionality I need.